A
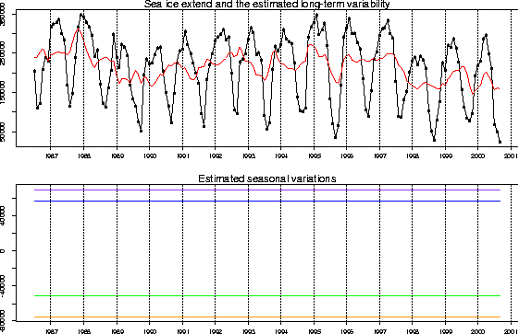
special trend-analysis tool is provided in the EuroClim portal. For a selected
region and time series of data, a trend can be calculated using a statistical
model. An example is shown here for one of the sea ice regions. Upper panel:
The monthly area of SIC (dots) and the estimated long-term variability (red
line). Lower panel: The components of seasonal variations for winter (blue
line), spring (purple line), summer (green) and autumn (yellow) plotted as
the deviation from the long-term variability (red line in the upper panel).
The vertical lines in each plot indicate the start of a new year

