 |
 |
 |
 |
 |
 |
 |
 |
 |
 |
 |
 |
 |
 |
Sea Ice Concentration and Extent
 |
 |
 |
 |
 |
 |
 |
 |
 |
 |
 |
 |
 |
 |
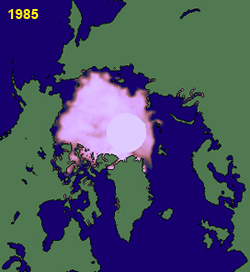
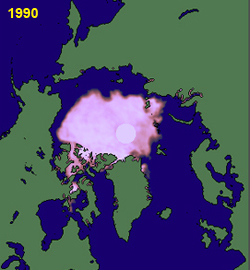
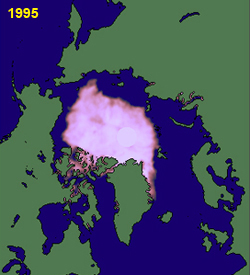
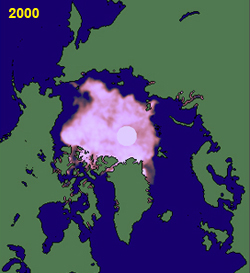
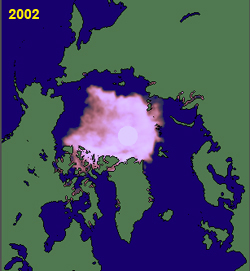
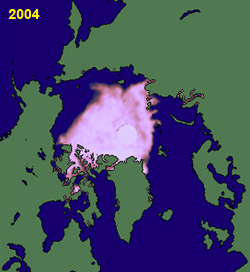
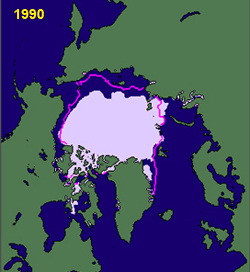
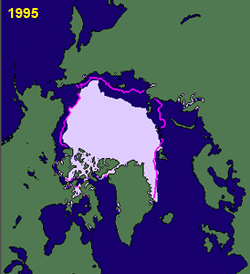
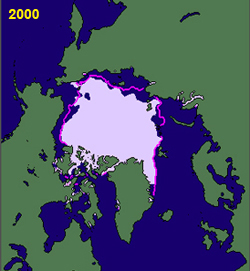
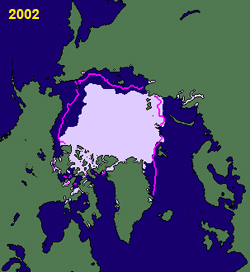
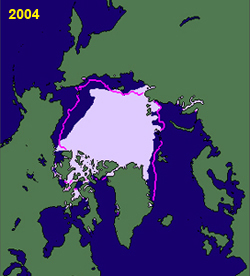
The top row shows sea ice concentration for the month of September of the year specified. The bottom row shows sea ice extent for the month of September in the specified year, with the median ice edge drawn in for comparison.
Source and for more information, see NSIDC webpage
Year |
Sea
Ice Extent |
Sea
Ice Concentration |
1980 |
7.8 |
4.8 |
1985 |
6.9 |
4.2 |
1990 |
6.2 |
4.5 |
1995 |
6.1 |
4.4 |
2000 |
6.3 |
4.3 |
2002 |
6.0 |
4.0 |
2004 |
6.1 |
4.4 |
Figures
are in million sq. km. Source |
||
