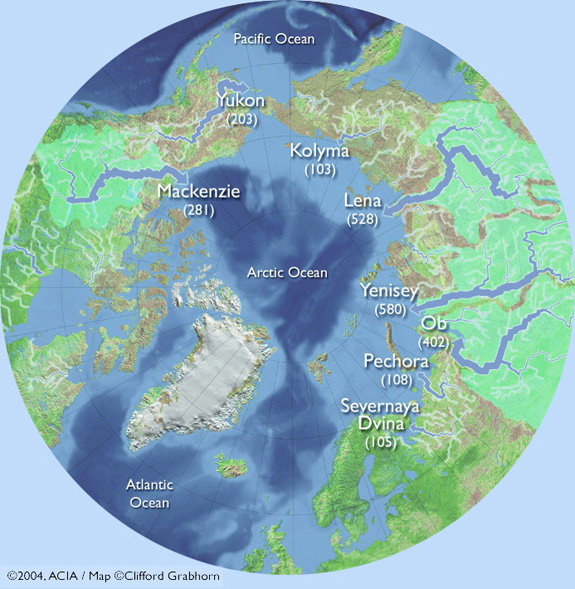
Arctic
river basins. The thickness of the blue lines represents the relative river
discharge, with the thickest lines indicating the rivers with the largest
volume. The numbers on the map are the discharge in cubic kilometers per year.
Map is from the Arctic
Climate Impact Assessment Report.
This graphic is also found at the NOAA
site